
Ask a Supply Chain director for one view of transport cost, volume and service across the whole network, and the answer is rarely “here it is”. Not because the data is missing, but because it is spread across the systems and partners that run transport every day.
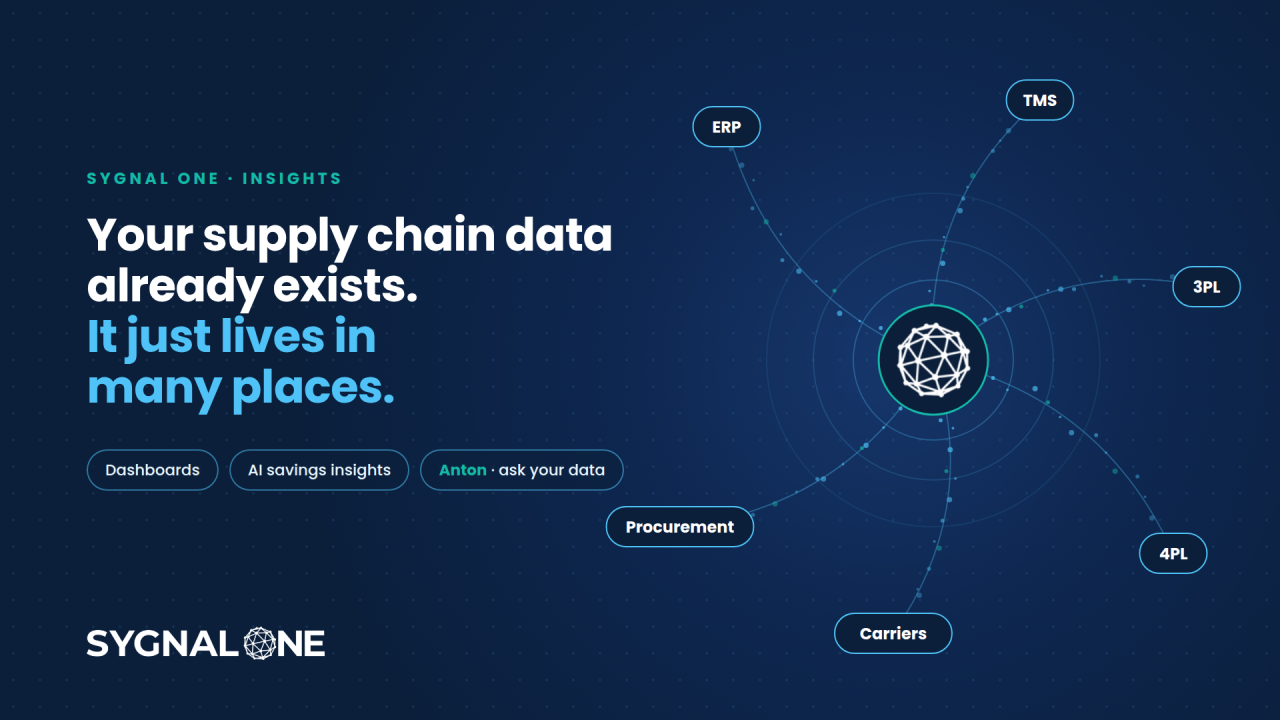
Most of the manufacturers we work with have a rich landscape: ERP systems per region or business unit, a TMS in some countries, 3PL and 4PL partners managing flows on their behalf, rate cards and tenders held by procurement. Each of these does its job well. Each also records transport in its own format, language, currency and unit. That is not a failing of any system. It is simply what happens when a business grows across countries, partners and acquisitions.
Working with shippers like this, from single-country operations to multi-region networks, a few lessons keep coming back.
Start with what is already there
The fastest route to a global view is rarely a new systems project. It is making better use of the data the existing landscape already produces: shipment and cost reports from the ERPs, execution data from the TMS, reporting from 3PL and 4PL partners, rates and tenders from procurement.
Some of that arrives as scheduled reports, some through direct connections with TMS and logistics partners. Both work. What matters is that the flow is secure, repeatable and easy for the teams and partners involved. The first dashboards can then arrive in weeks, and deeper connections are added where they bring the most value.
The data tells you what you can and cannot measure
The second lesson arrives the moment the data comes together. Each source is often complete for its own purpose, yet the combined picture has gaps. A delivery date recorded by one partner but not in the ERP. Rate cards that cover only part of the lanes actually used. Fuel surcharges handled differently per country or contract. Freight cost folded into the product price and therefore out of sight.
None of this is bad data management. It is what happens when every site, system and partner is set up for its own role. It is also exactly where the savings hide: truck and container fill, consolidation, delivery frequency, accessorials, carrier compliance. You cannot improve what you cannot see consistently.
Agree what good looks like before the first file lands
The projects that work start with a short, explicit list: a baseline of how transport is managed today, a coverage target, one global view of cost, volume and service, and a handful of quantified opportunities. It keeps the work focused, and it brings the hard questions, such as how you measure coverage across many sources, to the start rather than the end.
The output is more than a set of dashboards. AI-driven insights find and quantify the savings levers across the network and rank them by value, so the team knows where to act first. And with a domain-trained AI consultant, such as our own Anton, anyone on the logistics team can ask questions of the data in plain language: which lanes drove cost up last quarter, where truck fill dropped, how one region compares with another. No report request, no waiting.
And one outcome is easy to overlook: clean, consolidated data that everyone can use. Procurement for tenders, network planning for modelling, and TMS and logistics partners for sharper execution and joint improvement. Dashboards, insights and answers are what people see. Reusable clean data is the foundation underneath.
One view, built on the whole ecosystem
Global visibility does not replace the systems and partners that run transport. It connects them. The ERP, the TMS, the 3PL and the 4PL each hold part of the story; together, harmonised, they tell the whole of it.
Start with the data you already have. Connect it securely, in whatever way suits each source. Treat every gap as a finding, not a failure. Agree upfront what good looks like. And make sure the result goes beyond a dashboard: quantified savings insights, answers on demand, and clean data that strengthens every part of the ecosystem.
That is the layer we have built at Sygnal One, working alongside the systems and partners our customers already rely on.
If this sounds like your organisation, send us a message.
Published by Sygnal One, exploring the intersection of data, intelligence, and operational performance in logistics and supply chain.