Your transport costs are rising 10–15% in Europe and 20–25% in North America, from diesel alone.
It is not all bad news. There are things you can do.
Europe
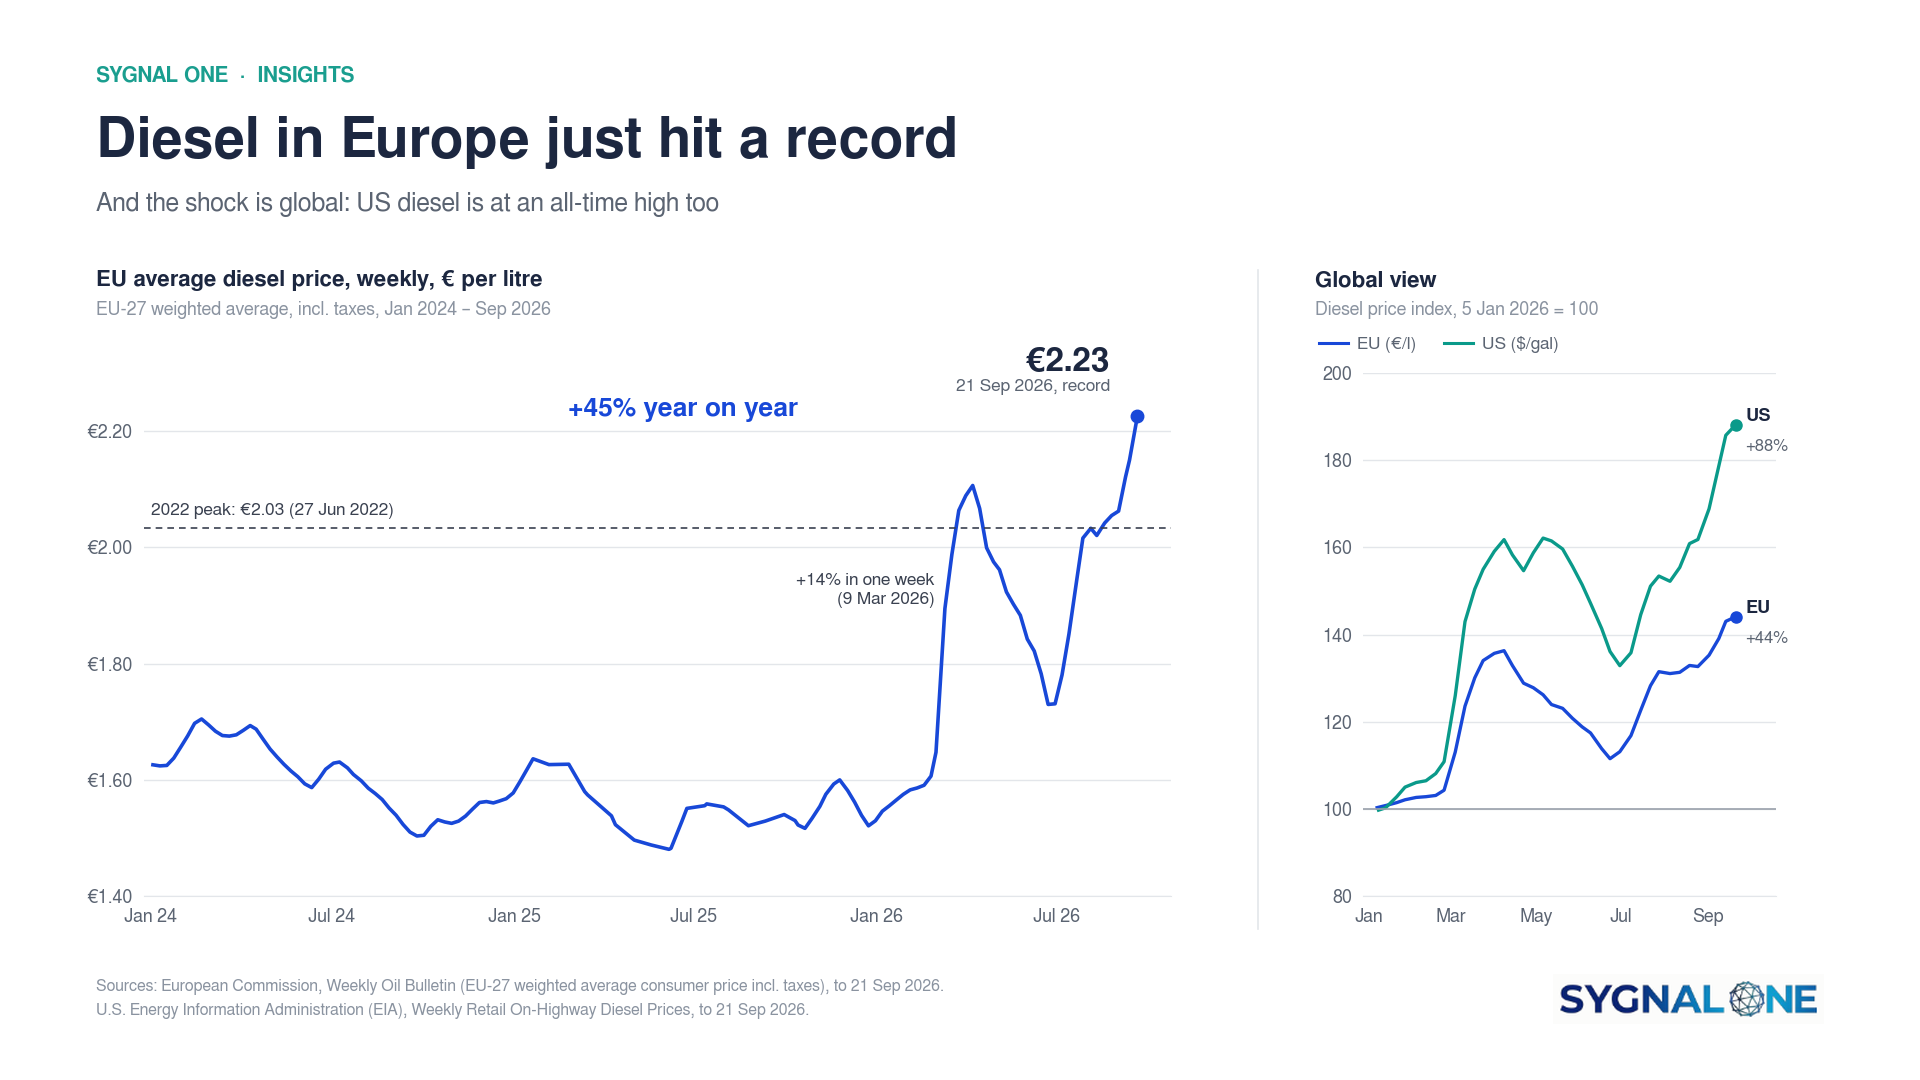
The EU average hit €2.23 a litre on 21 September, up 44% since January and 45% on a year ago. Road freight contract rates were already 15% up year on year in Q2, before this spike.
North America
US on-highway diesel reached $6.53 a gallon the same week, an all-time high and up 88% since January. Surcharges reset weekly off the DOE index, so it flows straight into Q4 rates and RFP season.
Fuel is roughly 25–30% of the cost of a truck move. Apply that to the diesel rise and you get the range above. The only way to mitigate increases of this size is to leverage the intelligence in your business.
Why most shippers can’t see it
- Fuel is handled differently per contract, country and carrier: a percentage here, cents per mile there, built into the base rate elsewhere.
- Freight is often buried in a delivered price, so margin erodes without a transport line.
- Surcharges lag the index, so the full hit lands next month.
Five questions to ask now
- Which customers and lanes have seen the biggest rise in cost per unit since January?
- How much of that is fuel, and how much is base rate, tolls or accessorials?
- Where freight is built into the price, does it still cover today’s cost to serve?
- Is the procured carrier base always being used, or is a lack of capacity forcing the use of more expensive carriers or the spot market?
- Which levers take kilometres or miles out: fuller trucks, consolidation, delivery frequency, mode?
It all starts with data
Shipment, cost and rate data connected across ERP, TMS and logistics partners, with fuel normalised across contracts, countries and regions. Once you have that, domain-trained AI can rank the levers by value and answer the questions above in seconds.
Record diesel is a cost nobody chose. Take control and mitigate these record prices.
Want to see what the fuel shock means for your network and how to mitigate it? Send us a message.
Sources: European Commission Weekly Oil Bulletin; US EIA and USDA AgTransport weekly diesel prices; IRU; IRU/Ti/Upply Q2 2026 benchmark. Figures to the week ended 21 September 2026. The 25–30% fuel share is an illustrative assumption.
Published by Sygnal One, exploring the intersection of data, intelligence, and operational performance in logistics and supply chain.